Report
Put It Where You're Already Looking
If you spend the day in a terminal with a coding agent, the line under the prompt is the one screen you never miss. What a fuel gauge for Claude Code taught me about what belongs there.

Spending against limits all day
If your day happens in a terminal with a coding agent, you're spending against limits all day: what this session costs, how much of your plan's week is gone, how full the conversation's memory is. Claude Code knows all three, after every message.
Claude Code pipes a JSON blob to a configurable statusLine command after each
assistant message: the session's cost at API list price, the context-window fill, the model, and on
subscription accounts the seven-day rate-limit window.
Demonstrated at AI Tinkerers Seattle, Dev Tools track, Nov 3 2026; featured in the AI Tinkerers Community Spotlights newsletter.
The numbers are somewhere else
Those numbers live on a page somewhere else. Checking them means stopping work to go and look, so you check late, or not at all, and find out about a limit after you've crossed it.
A limit you have to poll is a limit you find out about after crossing it. On a flat plan the symptom is out-of-plan charges: I had seven between Aug 29 and Sep 2.
What I tried first
1. A usage page, refreshed by hand
For a while I kept a second window open on my Claude usage page, and every so often I'd switch over and press refresh to see how much of the week I'd used. It worked when I remembered, which was not when it mattered.
A browser tab on the usage page is accurate, but reading it takes focus away from the terminal, and it is never in front of you when you're deep in a task. It's pull, not push.
2. A dashboard you visit
Charts of the week, somewhere you can look back at them. Good for reviewing how the week went, with the same flaw: you have to go and look.
Polling usage into a dashboard adds a server, a key and a schedule, and still needs a visit. It's the right place for anything you'd study; it's the wrong place for anything that has to be seen in time.
The line under the prompt
Put the things you should be watching in the one place you're always looking. If your day happens in a terminal, that's the line under the prompt. It updates by itself, so you never go looking for it, and you never forget to look. The gas gauge is one line, after every message:
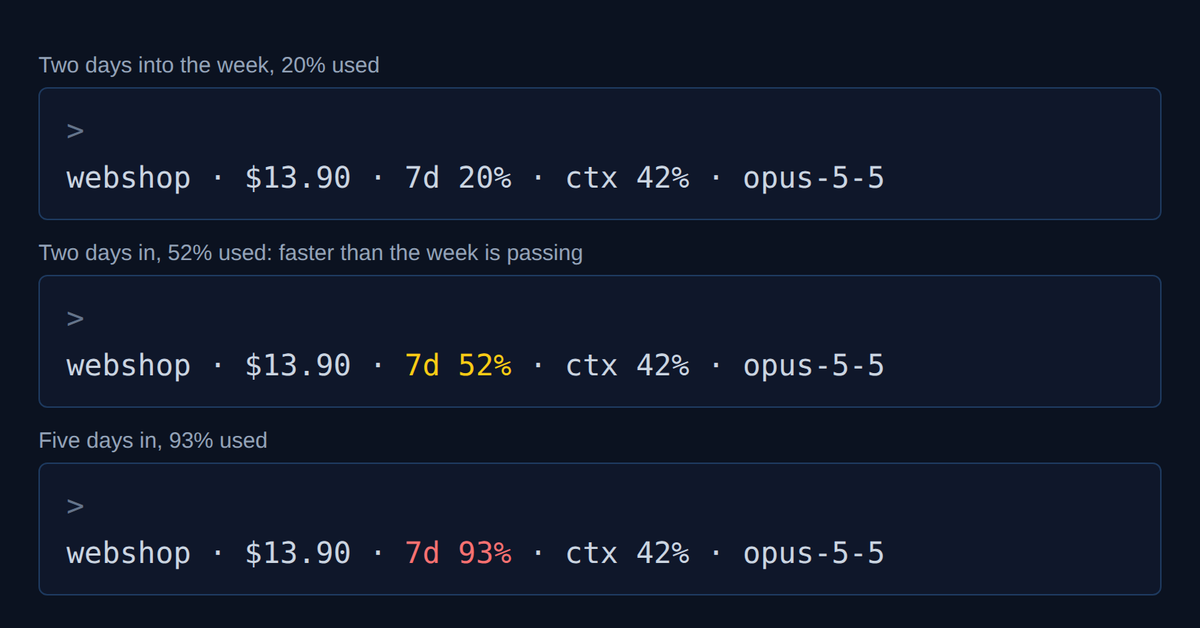
webshop · $13.90 · 7d 31% · ctx 42% · opus-5-5That's the project you're in, what this session would cost at list price, how much of your plan's weekly allowance is used, how full the conversation's memory is, and which model is answering. The week turns yellow when you're using it faster than time is passing (more than a seventh of the week gone in a day, say), and red when it's nearly empty.
The status line is the only surface in a terminal session that redraws without being asked and
never takes focus. Claude Code re-runs it on events (a new message, a model or mode change, a
rate-limit window resetting), debounced at 300 ms, and on a timer if you set
refreshInterval. A status-line command that reads its JSON needs no polling, no API
key and no daemon.
webshop · $13.90 · 7d 31% · ctx 42% · opus-5-5gas-gauge is a few hundred lines of Python with no dependencies. It reads the
status-line JSON from stdin, prints the segments, and never fails: bad or missing input prints
nothing and exits 0. The pace rule compares a window's used fraction with its elapsed fraction. It
also writes one JSON file per session, so other tools can read what a session cost without anyone
pasting /usage. --usage-api adds the model's own weekly allocation, and
the plan segment flags when your recent weeks fit another plan better.
What it changed
Before, I found out I'd run out when I ran out. After, I could see the week going and change course the same afternoon: finish the task, start nothing big, switch to a cheaper model. On a flat monthly plan I've had no extra charges since September 2.
The per-session file is what made the rest possible. Every session becomes a row in a ledger with its real price, so spend can be charged to the project it served (the method the workshop teaches). The gauge is the meter, and the ledger is the accounting. Without the meter, the ledger is someone pasting numbers by hand, and it doesn't get done. (Invoices: seven out-of-plan charges from Aug 29 to Sep 2, then only the monthly plan charge on Sep 10, Oct 10 and Nov 10.)
Try it
uv tool install git+https://github.com/ivantohelpyou/claude-gas-gaugeThen in ~/.claude/settings.json:
"statusLine": { "type": "command", "command": "gas-gauge" }. The line appears after
the next message.
Where it fits, and where it doesn't
It's for people who live in a terminal with a coding agent. If you work mostly in a browser or the desktop app, the same idea applies, but this tool doesn't. It's a gauge, not a dashboard: one line, glanced at, never studied.
Status-line real estate is small. It redraws on events, and when the session is idle only if
refreshInterval is set (mine is 15 seconds). A segment must be fast (it runs every
turn), short, and fail silently. Anything slow, wide or interactive belongs elsewhere. The gauge
reports prices, not bills: on a flat plan $13.90 is what the session would have cost
at API rates.